POL 304: Using Data to Understand Politics and Society
Intro to Network Analysis
Olga Chyzh [www.olgachyzh.com]
Today's Class
Definitions. What is network analysis?
Network data
Network features and measurements
An application: modeling contagion
Would You Win $1,000,000?
Suppose you are playing the following game:
If you can get all your friends to meet you at the entrance to the ROM in exactly 1 hour, you will win $1,000,000. The catch is that you can only contact one friend, and not all your friends know each other. Which friend would you call and why?
| Sender | Receiver |
|---|---|
| 1 | 2, 3 |
| 2 | 1, 3, 4, 5 |
| 3 | 1, 2, 4, 5 |
| 4 | 2, 3, 5, 7 |
| 5 | 2, 3, 4, 6, 7 |
| 6 | 5, 7, 8 |
| 7 | 4, 5, 6 |
| 8 | 6, 9, 12 |
| 9 | 8, 10 |
| 10 | 9 |
| 11 | 12 |
| 12 | 8, 11, 13, 14, 15, 16 |
| 13 | 12 |
| 14 | 12 |
| 15 | 12 |
| 16 | 12 |
Visualization of the Friends Network
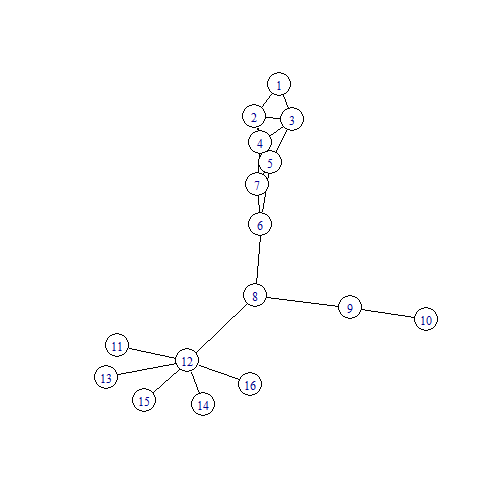
Discussion
What criterion helps spread the message in the fewest possible steps?
What are social science applications of this game?
Why Do We Need Network Analysis?
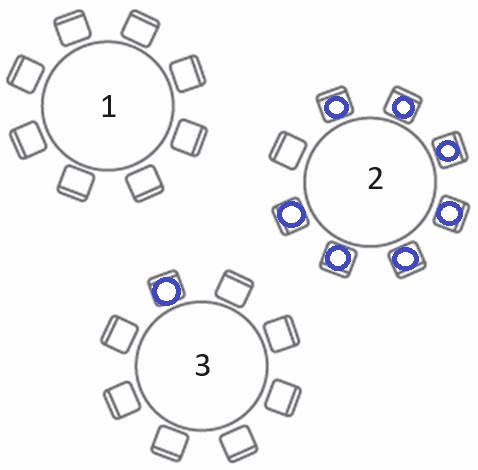
Suppose you walked into a dining room that hosts a luncheon at a conference you are currently attending. What table would you sit at?
Network Analysis: Formal Definitions
What is a network (i.e., a graph)?
A set of nodes and relation(s) defined on them
Defining a Network: What's a node?
- A node can be defined as an entity that can form relations with other entities.
Synonyms:
- actor: from sociometry, common terminology in sociology and psychology
- vertex: from graph theory (i.e., math), common terminology in mathematics and physics
Term node is common in statistics and applied sciences outside of soc and psych.
Examples of Nodes
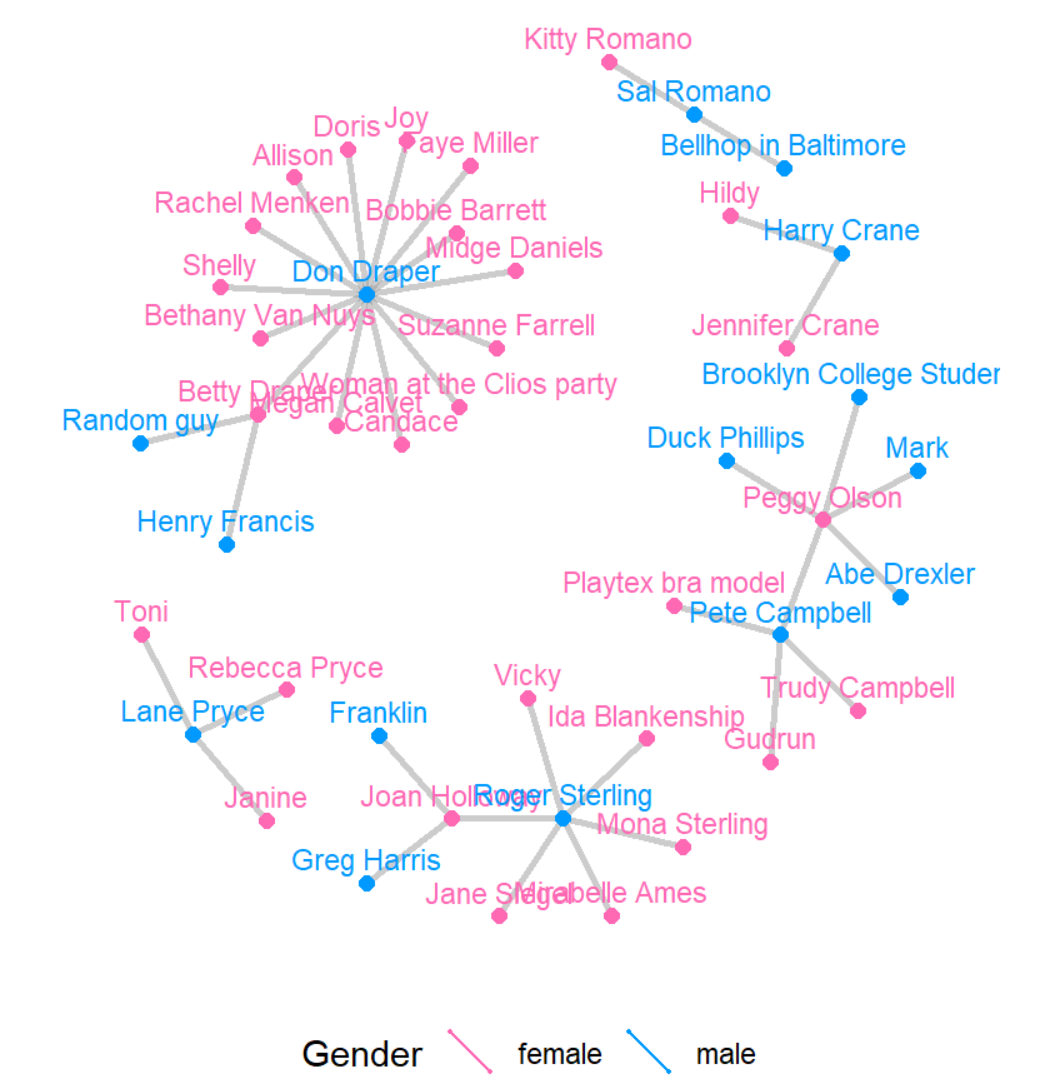
Individuals (Mad Men characters, legislators, terrorists)
Families
Organizations, Human Rights NGOs
Countries
Defining Network: What's a tie?
- A relation/tie defines the existence of an attribute relating nodes.
Synonyms:
- link: common in computer science (e.g., huge lit on “Link Prediction”) and social sciences
- edge: graph theoretic terminology common in physics and math, but also elsewhere
Ties can have characteristics:
- Weight
- Qualitative attributes
- Direction
Examples of Ties
Romantic relationship, marriage, friendship
Business relationship
Cooperation/conflict
Network graphs can reveal important structures
Adolescent romantic and sexual networks
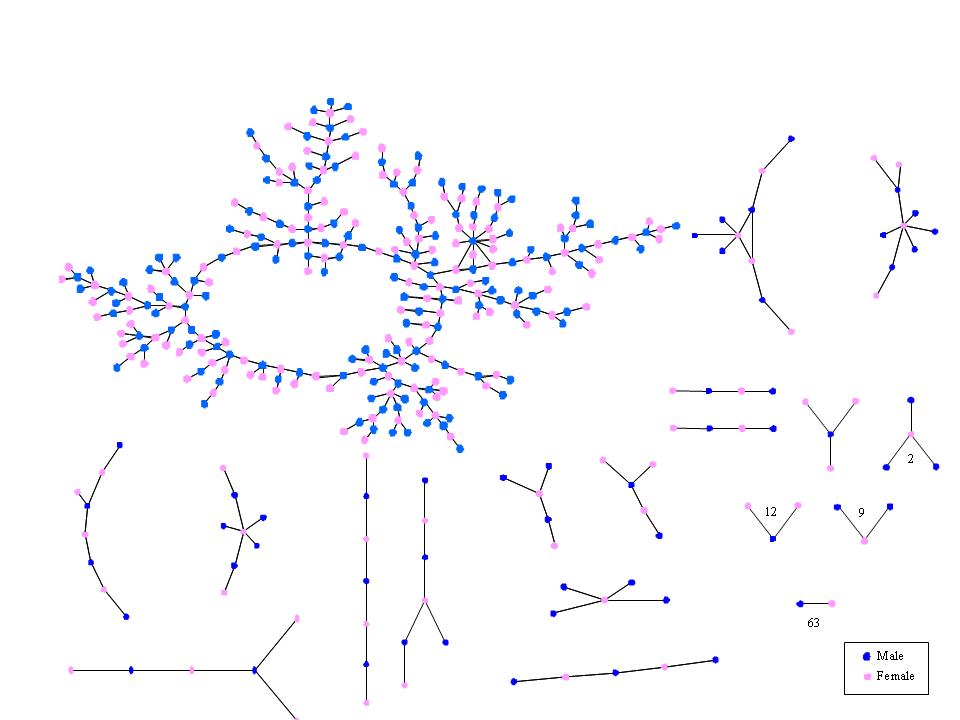 Bearman, Moody and Stovel
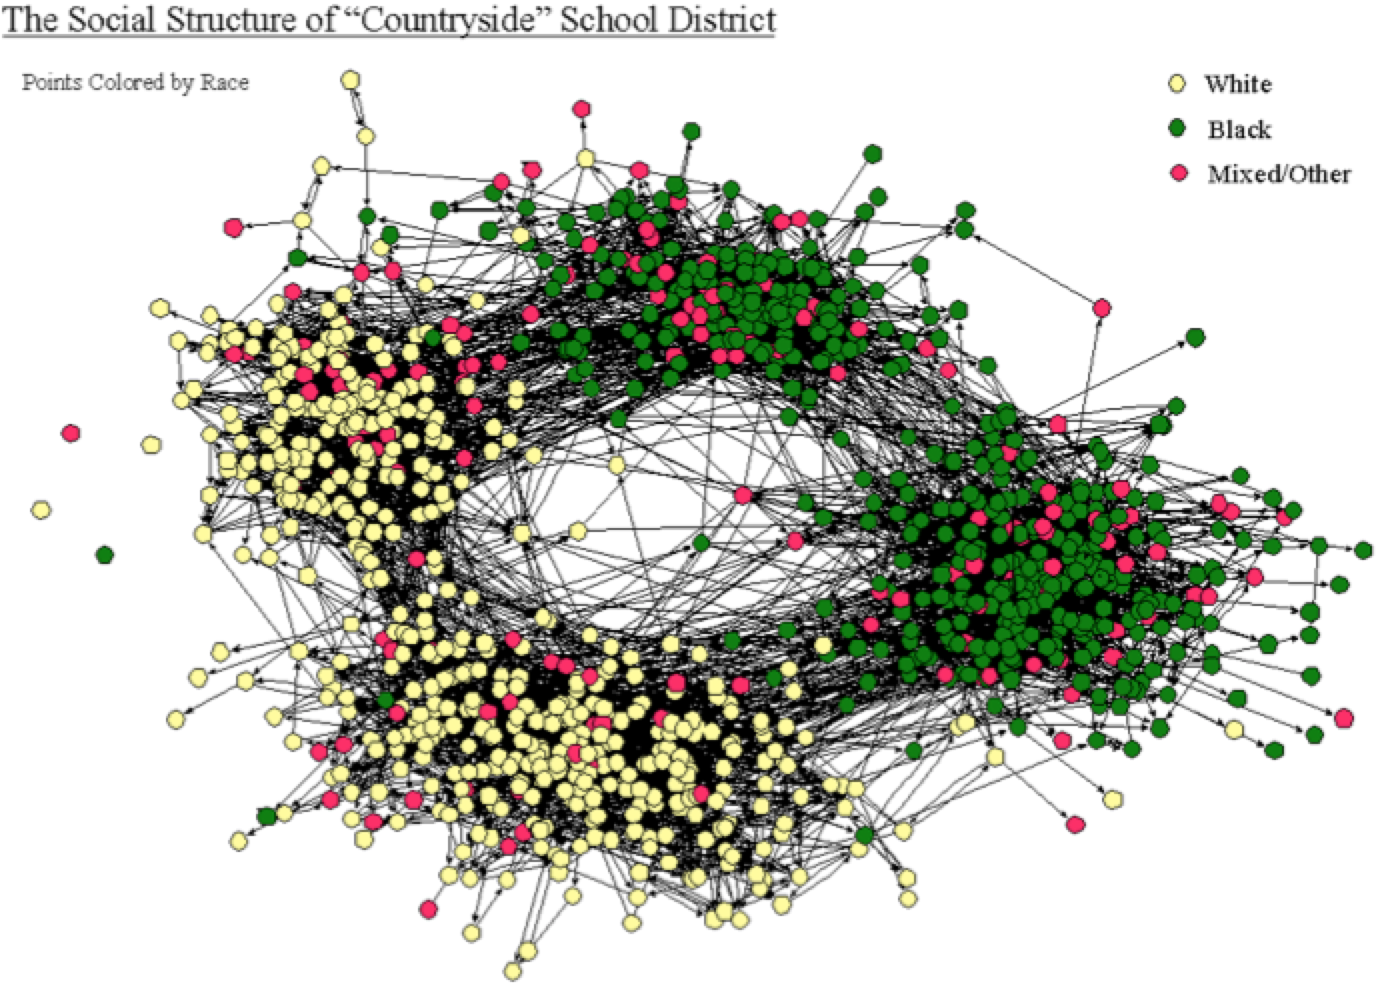
Adolescent Social Structure by Jim Moody
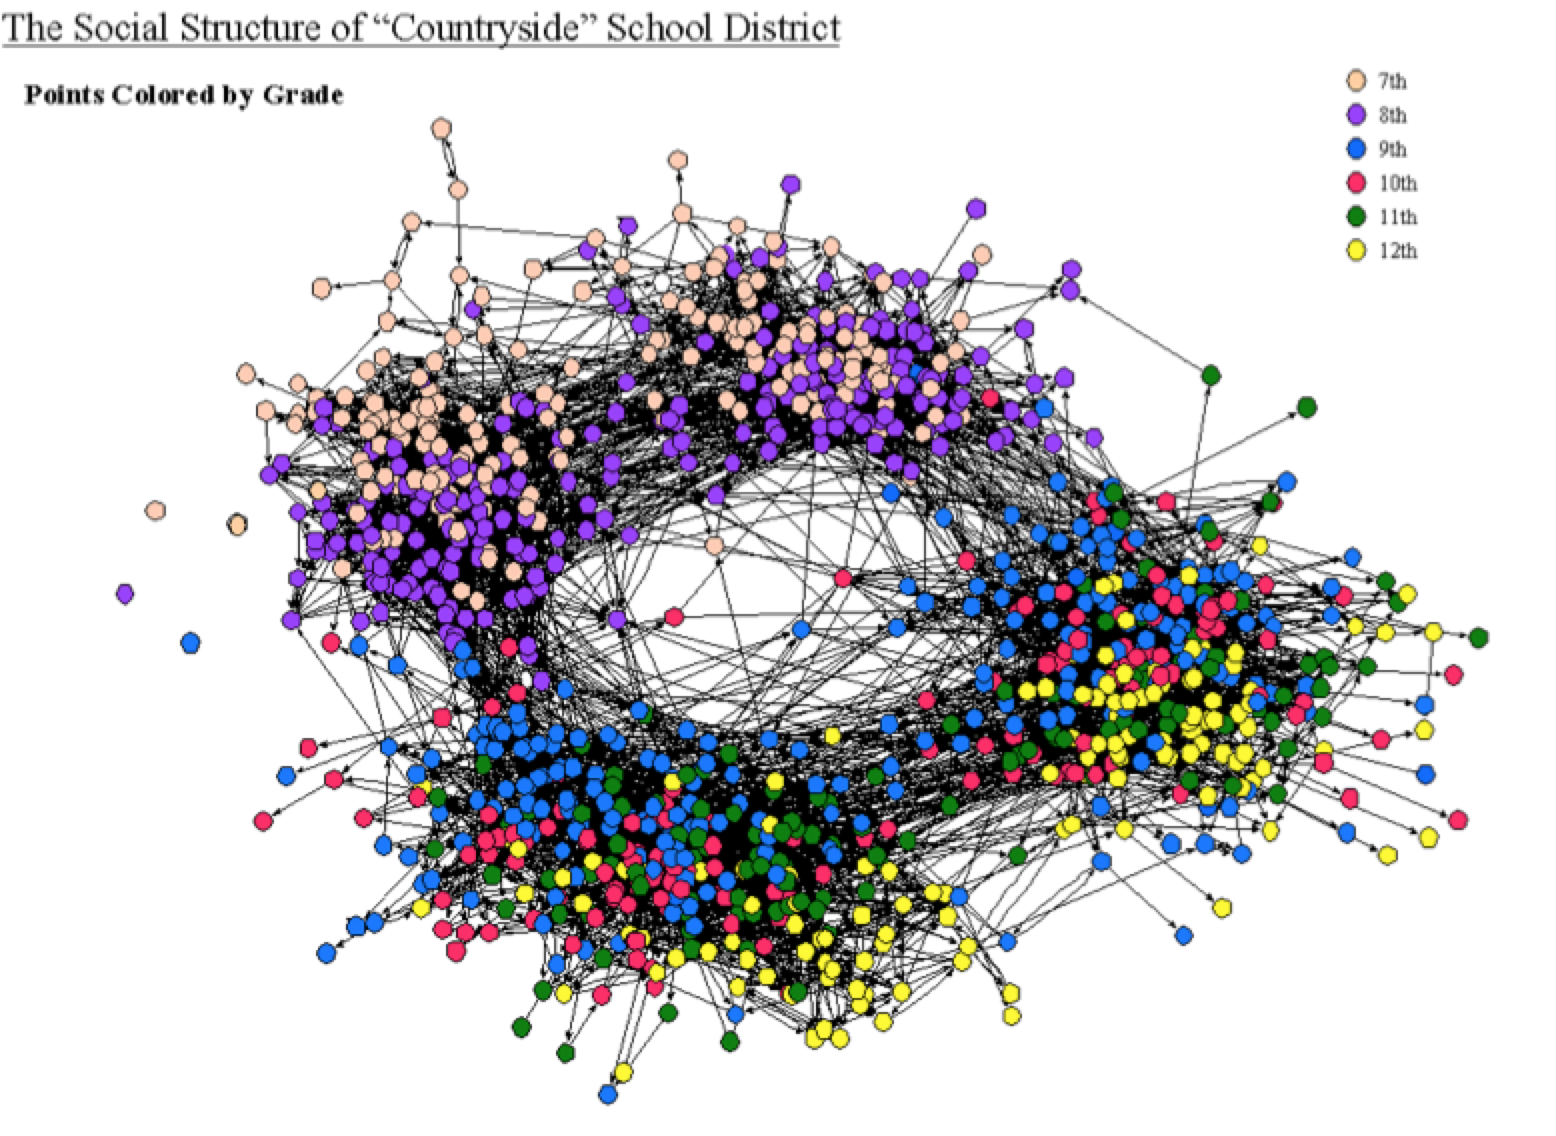
Adolescent Social Structure by Jim Moody
Other Important Definitions
An Adjacency Matrix
Network data are often stored in the form of adjacency matrices whose ijth element represents the relationship between nodes i and j.
## Acciaiuoli Albizzi Barbadori Bischeri Castellani Ginori## Acciaiuoli 0 0 0 0 0 0## Albizzi 0 0 0 0 0 1## Barbadori 0 0 0 0 1 0## Bischeri 0 0 0 0 0 0## Castellani 0 0 1 0 0 0## Ginori 0 1 0 0 0 0## Guadagni 0 1 0 1 0 0## Lamberteschi 0 0 0 0 0 0## Medici 1 1 1 0 0 0## Pazzi 0 0 0 0 0 0## Peruzzi 0 0 0 1 1 0## Pucci 0 0 0 0 0 0## Ridolfi 0 0 0 0 0 0## Salviati 0 0 0 0 0 0## Strozzi 0 0 0 1 1 0## Tornabuoni 0 0 0 0 0 0Network Measures: Centrality
Centrality measures help understand:
"Which node is the most important or central in this network?"
What do you mean by "important"?
What do you mean by "center"?
Definition of "center" varies by context/purpose
The power a person holds in an organization may be inversely proportional to the number of keys on their keyring
A janitor has keys to every office, and no power
The CEO does not need a key: people always open the door for her
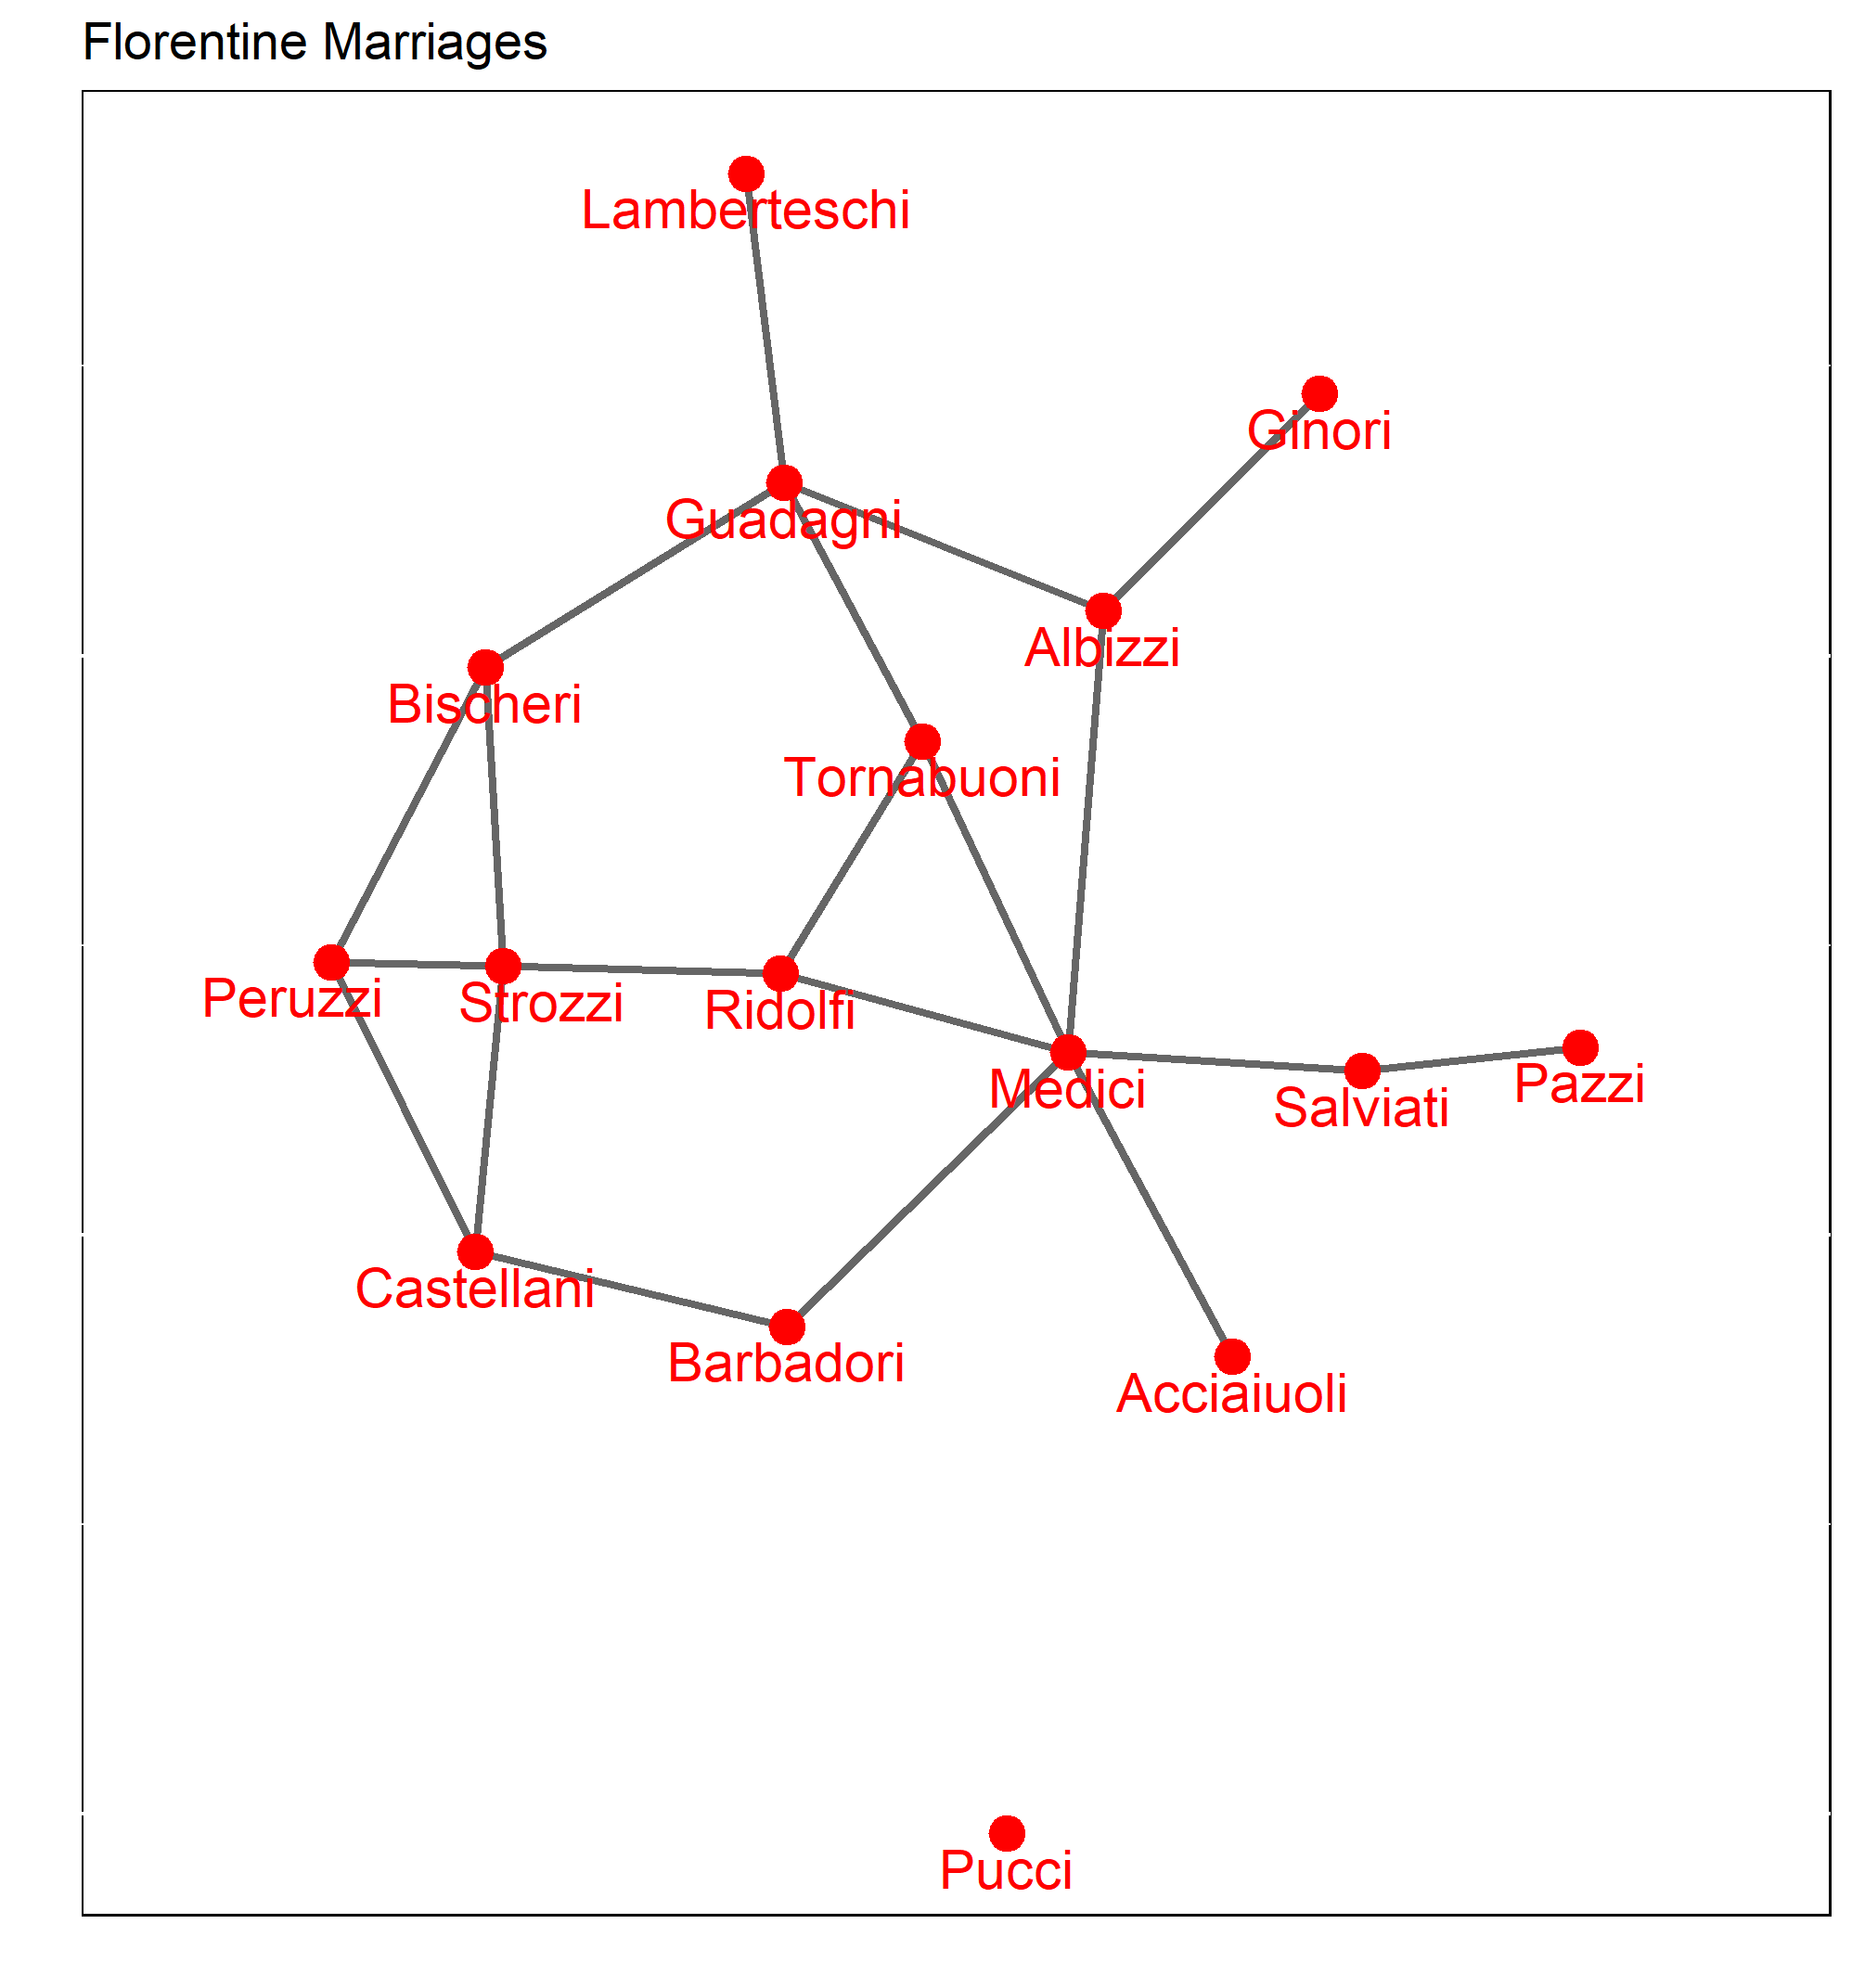
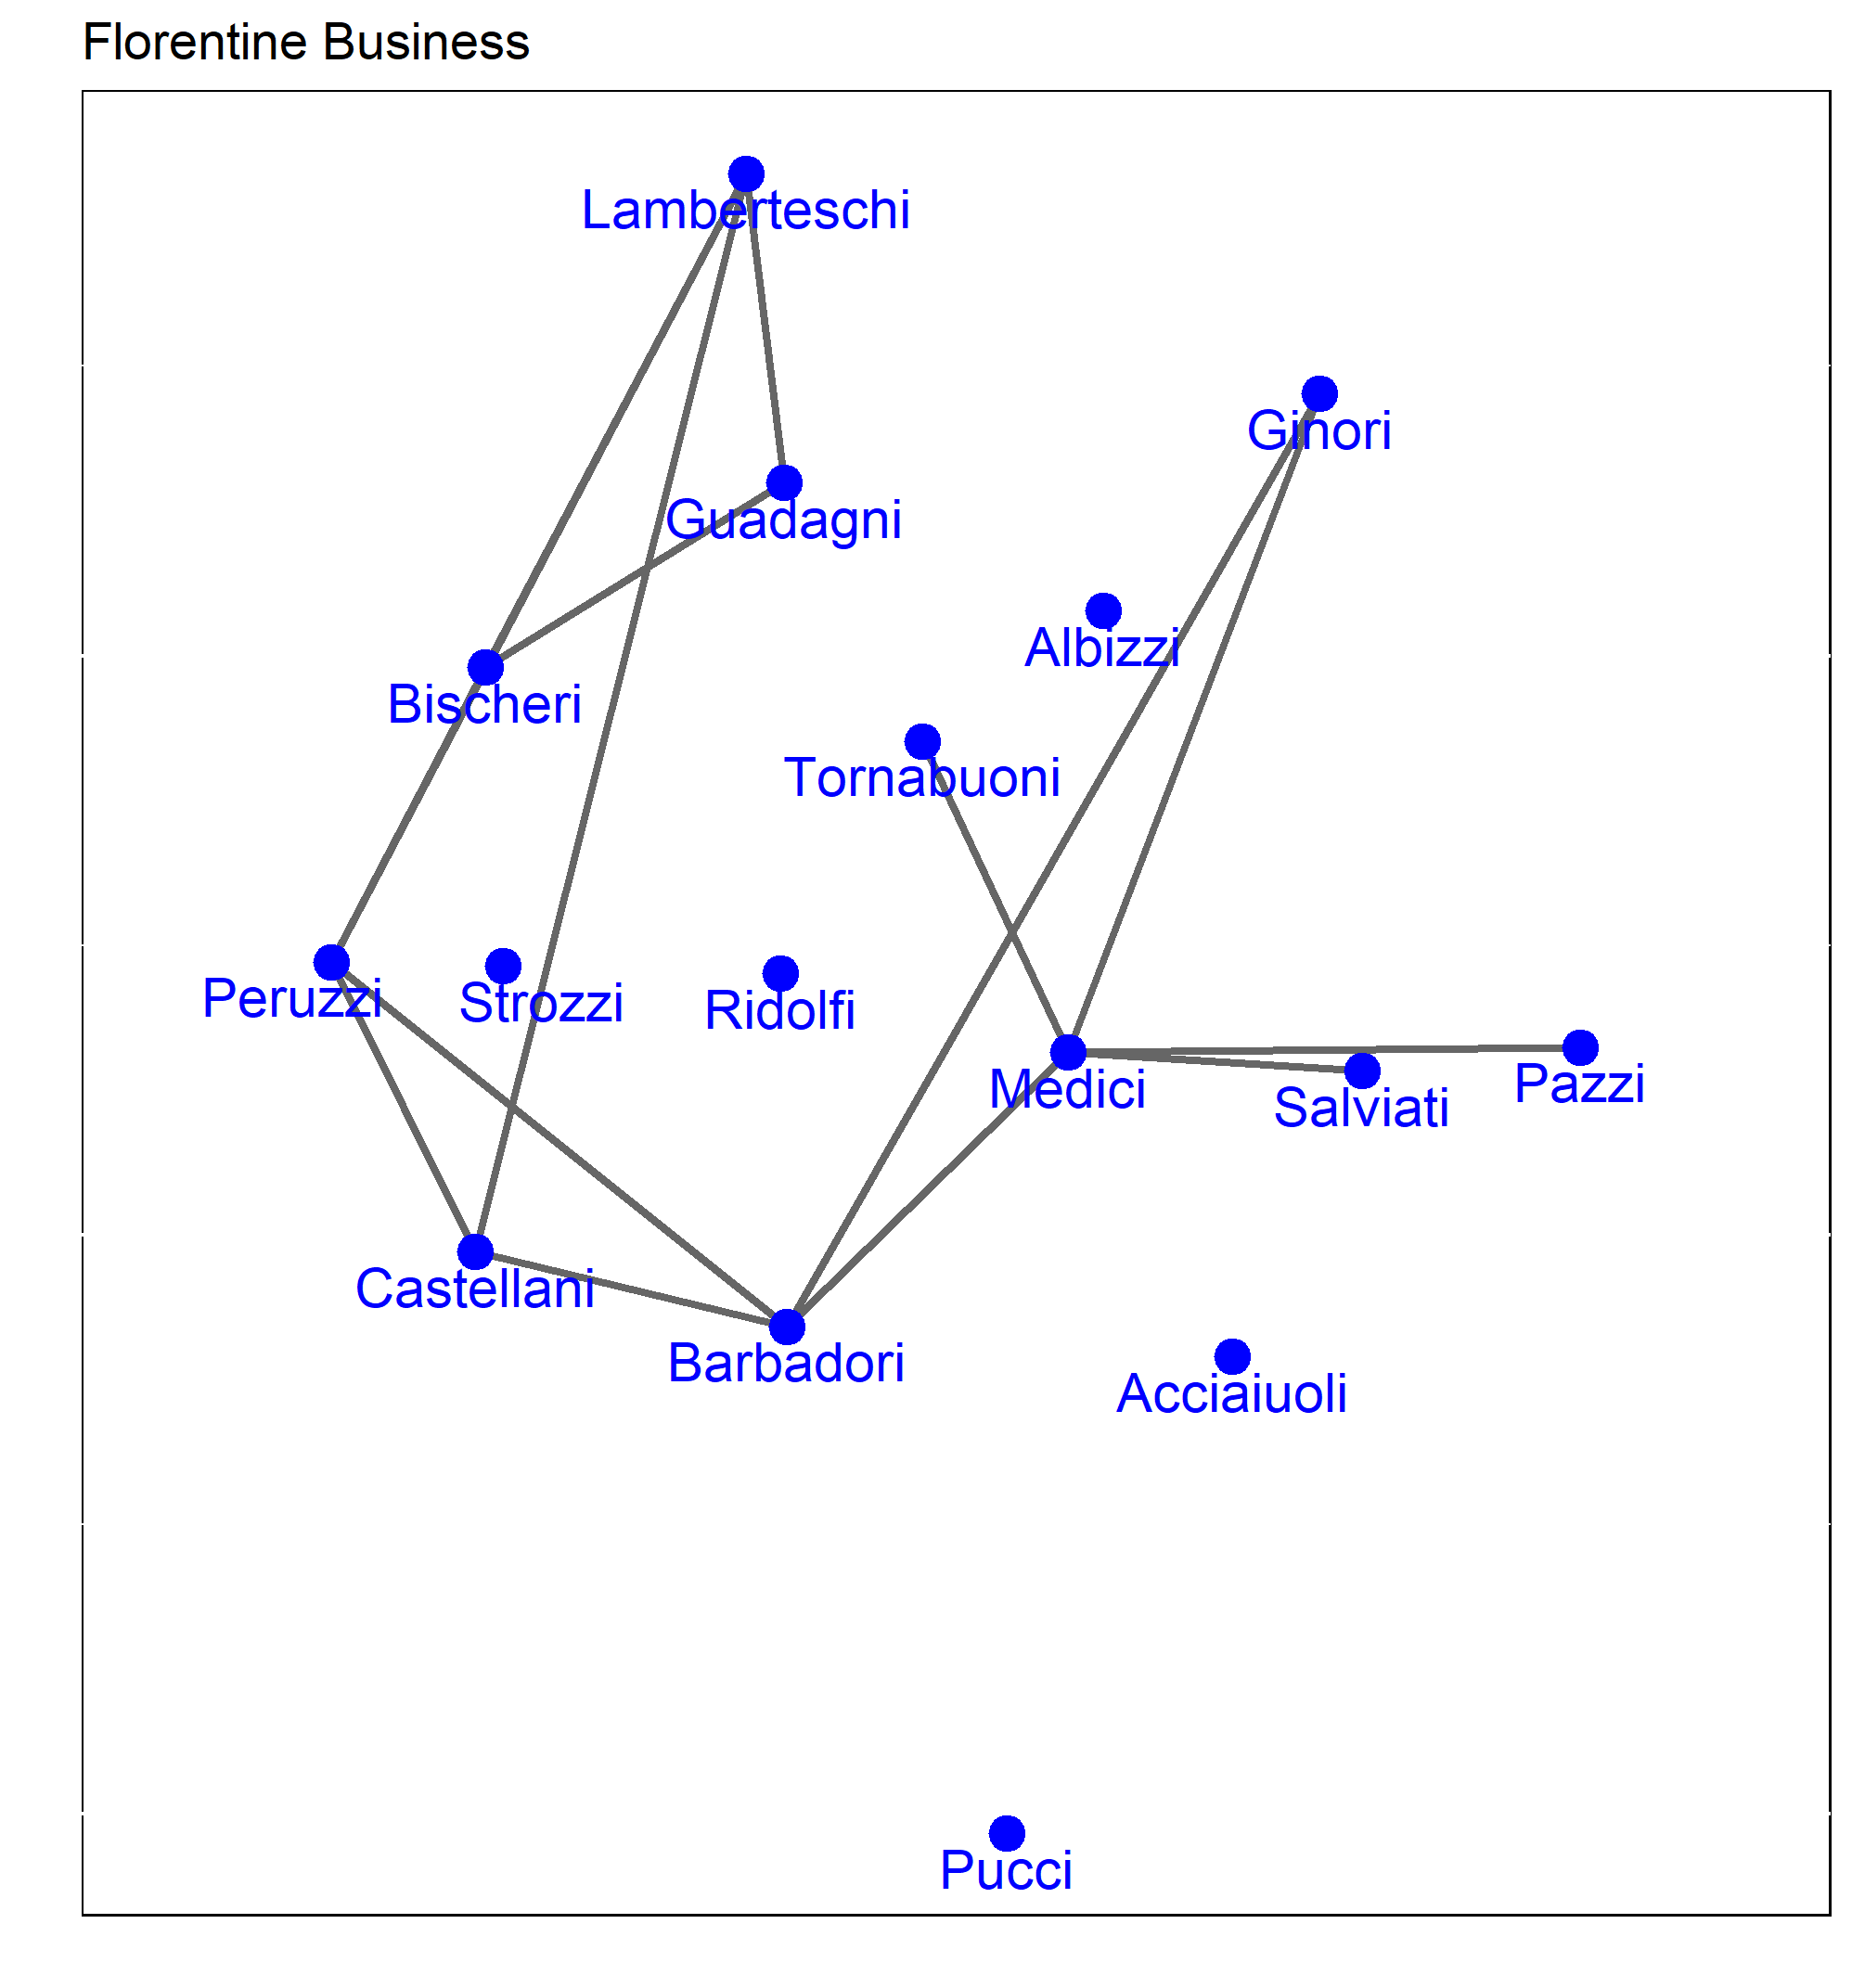
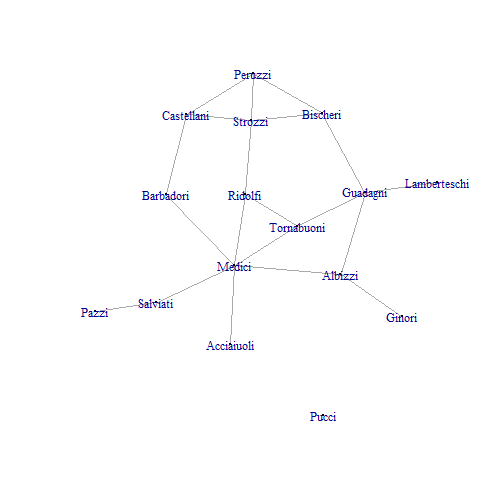
Florentine Families
Who looks central?
Network Measures: Degree Centrality
Idea: The nodes with more connections to others are more central
How to measure: node i's degree is the sum of its direct ties.
Though simple, degree is often a highly effective measure of the influence or importance of a node
- In many situations, people with more connections tend to have more power
- Examples where this might be useful?
Florentine Families: an Adjacency Matrix
How would you calculate Albizzi's degree centrality?
## Acciaiuoli Albizzi Barbadori Bischeri Castellani Ginori## Acciaiuoli 0 0 0 0 0 0## Albizzi 0 0 0 0 0 1## Barbadori 0 0 0 0 1 0## Bischeri 0 0 0 0 0 0## Castellani 0 0 1 0 0 0## Ginori 0 1 0 0 0 0## Guadagni 0 1 0 1 0 0## Lamberteschi 0 0 0 0 0 0## Medici 1 1 1 0 0 0## Pazzi 0 0 0 0 0 0## Peruzzi 0 0 0 1 1 0## Pucci 0 0 0 0 0 0## Ridolfi 0 0 0 0 0 0## Salviati 0 0 0 0 0 0## Strozzi 0 0 0 1 1 0## Tornabuoni 0 0 0 0 0 0Network Measures: The Shortest Path
The (geodesic) distance: di,j is the minimal path length from i to j.
Example: Can identify and count all nodes within the shortest path of 2 from i
Useful for modeling contagion, or spread of information.
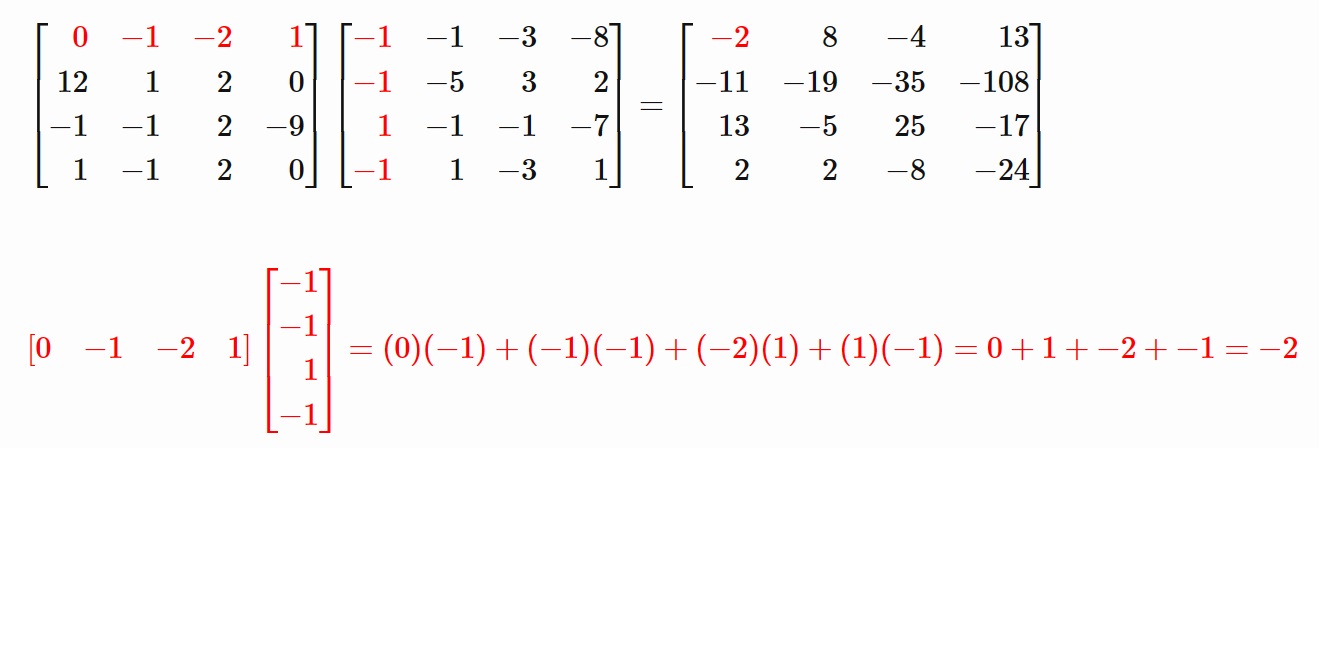
The Shortest Path: Calculation
Let Aij represent the adjacency matrix associated with a network of interest. It turns out that the ijth element of A2 will give you the number of the shortest paths of length 2 between i and j.
A
## 1 2 3 4 5 6 7 8 9 10## 1 0 0 0 0 0 0 0 0 1 0## 2 0 0 0 0 0 1 1 0 1 0## 3 0 0 0 0 1 0 0 0 1 0## 4 0 0 0 0 0 0 1 0 0 0## 5 0 0 1 0 0 0 0 0 0 0## 6 0 1 0 0 0 0 0 0 0 0## 7 0 1 0 1 0 0 0 1 0 0## 8 0 0 0 0 0 0 1 0 0 0## 9 1 1 1 0 0 0 0 0 0 0## 10 0 0 0 0 0 0 0 0 0 0A2
## 1 2 3 4 5 6 7 8 9 10## 1 0 1 1 0 0 0 0 0 0 0## 2 1 0 1 1 0 0 0 1 0 0## 3 1 1 0 0 0 0 0 0 0 0## 4 0 1 0 0 0 0 0 1 0 0## 5 0 0 0 0 0 0 0 0 1 0## 6 0 0 0 0 0 0 1 0 1 0## 7 0 0 0 0 0 1 0 0 1 0## 8 0 1 0 1 0 0 0 0 0 0## 9 0 0 0 0 1 1 1 0 0 0## 10 0 0 0 0 0 0 0 0 0 0Matrix Multiplication Refresher
Lab: A Network Model fo Contagion
Example: High-School Friendships
Open and explore the data
Notice that the data contain 2 waves (fall and spring), each stored as an adjacency matrix.
library(sna)data(coleman)coleman[1,1:10,1:10]## 1 2 3 4 5 6 7 8 9 10## 1 0 0 0 0 0 0 0 0 0 0## 2 0 0 0 0 0 0 0 0 0 0## 3 0 0 0 0 0 0 0 0 1 0## 4 0 0 0 0 1 0 0 0 0 0## 5 0 0 0 0 0 0 0 0 0 0## 6 0 0 0 0 0 0 0 0 0 0## 7 0 0 0 0 0 0 0 0 0 0## 8 0 0 0 0 0 0 0 0 0 0## 9 0 0 0 0 0 0 0 0 0 0## 10 0 0 0 0 0 0 0 0 0 0Make a Network Visualization
Convert to an igraph object:
library(igraph)ggraph<-graph_from_adjacency_matrix(coleman[1,,], mode="undirected", diag=FALSE)plot(ggraph, vertex.color="black", vertex.size=5, vertex.label=NA)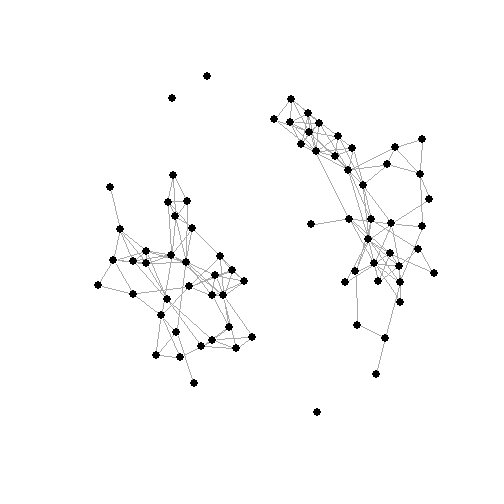
Calculate Degree Centrality for Each Node
degree.cent <- igraph::degree(ggraph)degree.cent## 1 2 3 4 5 6 7 8 9 10 11 12 13 14 15 16 17 18 19 20 21 22 23 24 25 26 ## 5 2 2 4 3 3 1 2 6 1 5 4 6 4 3 4 3 5 6 8 12 10 9 1 0 6 ## 27 28 29 30 31 32 33 34 35 36 37 38 39 40 41 42 43 44 45 46 47 48 49 50 51 52 ## 4 2 3 2 4 5 5 2 4 5 3 7 5 6 6 6 10 1 5 4 5 6 6 7 6 7 ## 53 54 55 56 57 58 59 60 61 62 63 64 65 66 67 68 69 70 71 72 73 ## 6 10 8 3 6 3 4 5 4 5 6 5 6 7 6 10 7 10 10 0 0Visualize Information Spread
Select the first individual to share the information with (the seed).
Color the seed node red.
V(ggraph)$color <- ifelse(V(ggraph)$name == 21, "red", "grey")plot(ggraph)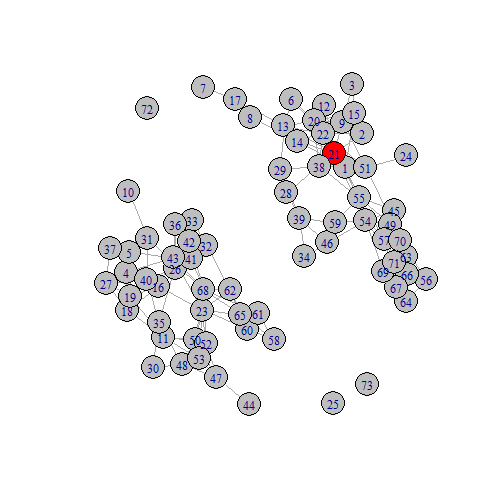
Shortest Path of 1
neighbors(ggraph,21)## + 12/73 vertices, named, from 1a6ab0a:## [1] 1 2 9 12 13 14 20 22 38 51 54 55V(ggraph)$color <- ifelse(V(ggraph)$name %in% neighbors(ggraph,21), "pink", "grey")V(ggraph)$color[V(ggraph)$name == 21]<- "red"plot(ggraph)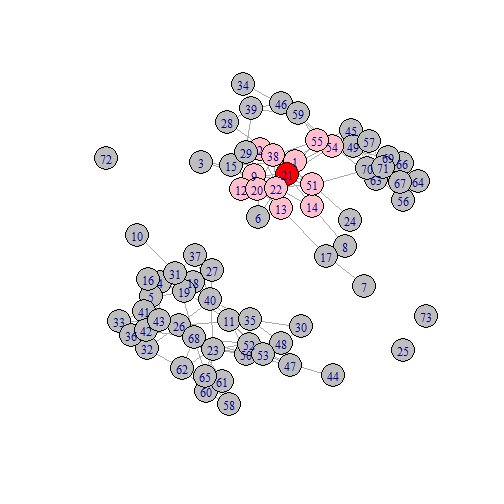
Shortest Path of 2
Convert
ggraphto an adjacency matrix, A.The elements of A2 will give you the number of shortest paths of length 2 between i's and each other node.
Select nodes that have 1 or more shortest path of length 2 to node 21.
mynet<-as.matrix(igraph::as_adj(ggraph))mynet2<-mynet%*%mynetdiag(mynet2)<-0 #a node cannot be connected to itselfneighbors2<-names(mynet2[21,][mynet2[21,]>0])neighbors2## [1] "1" "2" "3" "6" "8" "9" "12" "13" "14" "15" "17" "20" "22" "24" "28"## [16] "29" "38" "45" "46" "49" "51" "54" "55" "57" "59" "63" "69" "70" "71"V(ggraph)$color <- ifelse(V(ggraph)$name %in% neighbors2, "mistyrose", "grey")V(ggraph)$color[V(ggraph)$name %in% neighbors(ggraph,21)]<- "pink"V(ggraph)$color[V(ggraph)$name == 21]<- "red"plot(ggraph, vertex.label=NA)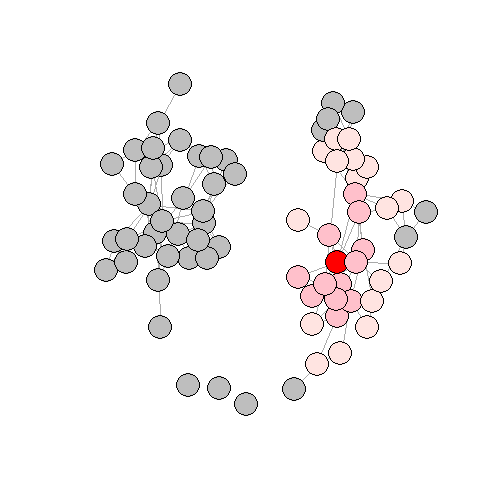
Your Turn
Below if the code to create the hypothetical friendship network used in the opening example.
- Model the spread of information in this network using "12", "6", and "8" as the seed.
el <- matrix( c("1", "2", "1", "3","2","3","3","5","2","4","2","5","3","4","4","5","4","7","6","5","5","7","6","7","6","8", "8","9","9","10", "8","12", "11","12", "12","13","12","14","12","15","12","16"), nc = 2, byrow = TRUE)g<-graph_from_edgelist(el, directed=F)