POL 304: Using Data to Understand Politics and Society
Measurement Bias
Olga Chyzh [www.olgachyzh.com]
Today's Agenda
Review Sections 3.1, 3.4.2 of QSS Chapter 3
Role of randomization in survey sampling
Non-response and other sources of bias
Survey Sampling
Problem
Most surveys/polls only interview several hundred people/voters
Goal: infer what 200 million adults are thinking
The 1936 Literary Digest Poll
Source: automobile registration, telephone books, etc.
Initial sample size: over 10 million straw vote ballots
Final sample size: over 2.3 million returned
The young Gallup used 50,000 respondents
| FDR's Vote Share | |
|---|---|
| Literary Digest | 43 |
| Gallup | 56 |
| Gallup's prediction for LD | 44 |
| Actual Outcome | 62 |
Parameter: election outcome
Data: a sample of respondents answering the question of which candidate they support
FDR (incumbent; from 1933 to 1945) vs. Alfred Landon (Kansas Governor)
Recovering from the Great Depression: New Deal
Selection bias: the initial frame -- screened out poor (only 1/4 households had telephones)
Gallup used only 3,000 to predict the Literary Digest's prediction in way advance
Poor voted for Roosevelt
Literary Digest went bankrupt afterward
But, Gallup was also a bit off
The 1948 Election
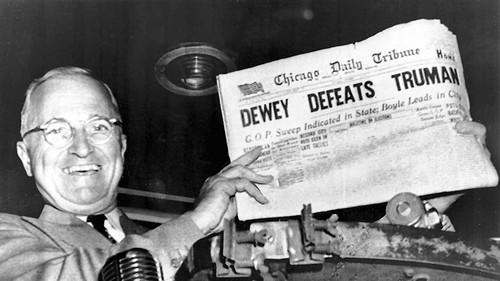
Harry Truman (incumbent; vice president of FDR who died in the office), Thomas Dewey (NY Governor)
World War II ending, the Cold War starting
Everyone thought Truman was going to lose
In fact, the newspaper went into press with the wrong news!
Why did the newspaper get the results wrong?
The Polling Disaster
| Truman | Dewey | Thurmond | Wallace | |
|---|---|---|---|---|
| Crossley | 45 | 50 | 2 | 3 |
| Gallup | 44 | 50 | 2 | 4 |
| Roper | 38 | 53 | 5 | 4 |
| Actual Outcome | 50 | 45 | 3 | 2 |
Quota sampling!
fixed quota of certain respondents for each interviewer
sample resembles the population with respect to these characteristics
potential unobserved confounding ⇝ selection bias
Quota sampling also suffers from potential bias with respect to the characteristics that are not used to create quotas
you can make sex, age, race, rent, etc. identical in distribution between the sample and the population
but that is not enough to make the distributions of Democratic and Republican votes identical to that in the population
There are always other factors that affect the outcome of interest
interviewers are free to choose within quota; tend to contact those who are easier to reach (having a telephone etc.)
Republicans were wealthier than Democrats; they were more likely to interview Republicans -- Republican bias
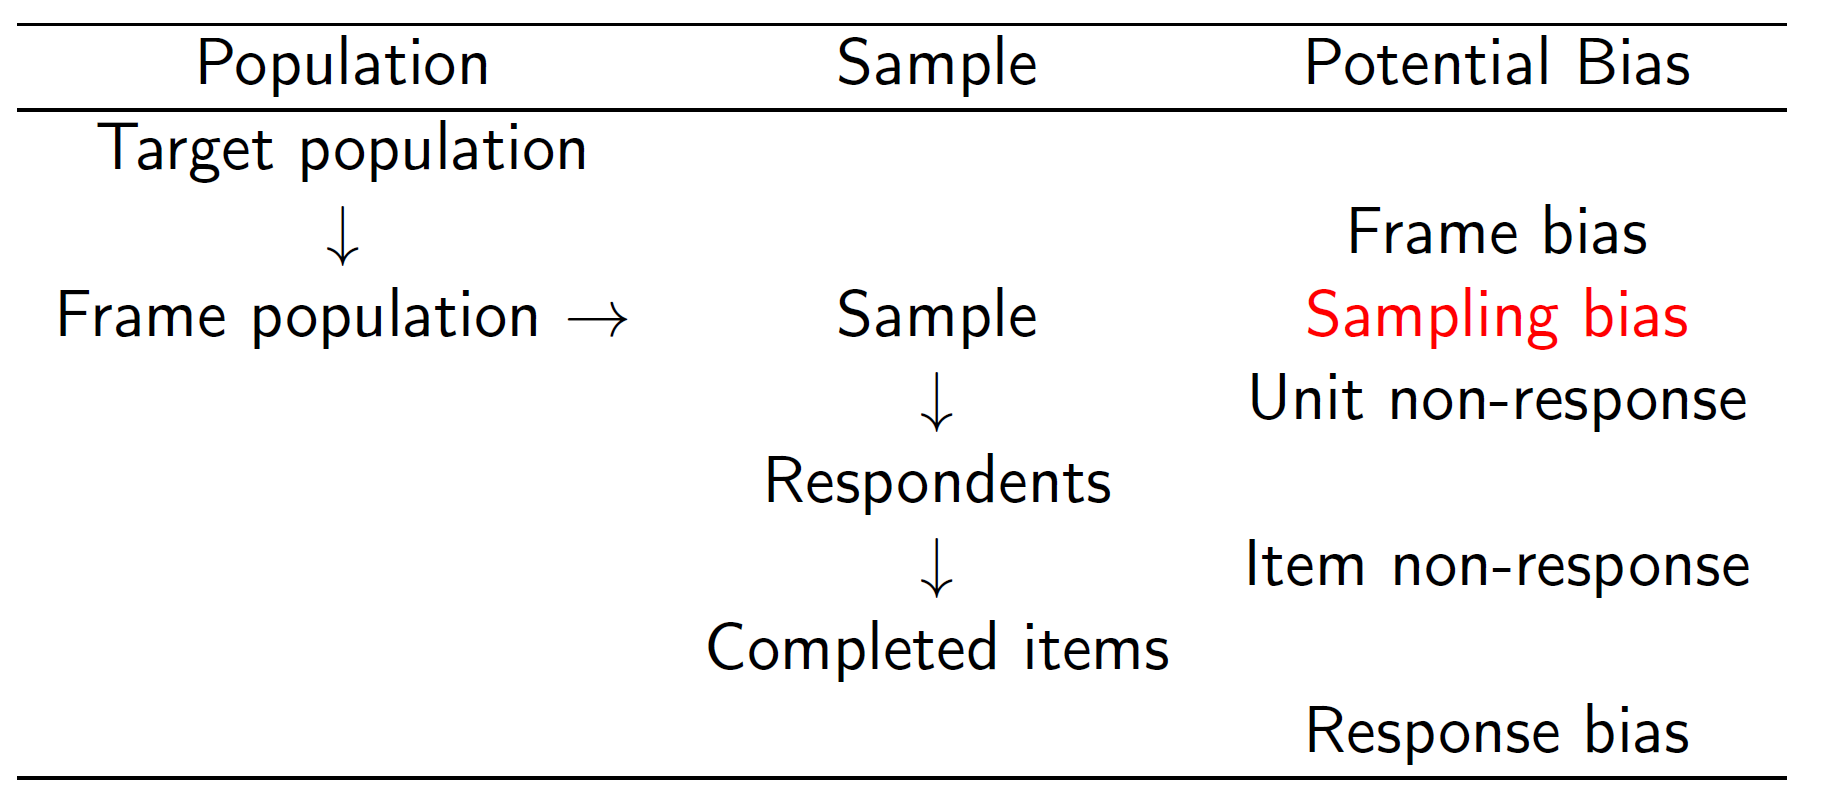
Sample Surveys
Probability sampling to ensure representativeness
Definition: every unit in the population has a known non-zero probability of being selected
Simple random sampling: every unit has an equal selection probability
Randomly sample units with some known probabilities
Inferential population = eligible voters
Frame population = phone numbers listed in a phone book
Probability vs. non-probability sampling; the former removes sampling bias
The decision to answer or not to answer isn't random
Response bias: lying, confusion, interviewer bias
Civilian Attitudes and War against Insurgency
Conventional war: military against another military
Counter-insurgency war: military against insurgents
From Vietnam war to war in Afghanistan
Key to victory: winning hearts and minds of civilians
aid provision, information campaign, minimizing civilian casualties
Non-Response and Other Sources of Bias
Item non-response, like unit non-response, can create bias
More violent areas ⇝ more non-response
Missing Values by Region: Support for the Taliban
| Helmand | Khost | Kunar | Logar | Uruzgan |
|---|---|---|---|---|
| 0.03 | 0.006 | 0 | 0 | 0.062 |
Missing Values by Region: Support for the ISAF
| Helmand | Khost | Kunar | Logar | Uruzgan |
|---|---|---|---|---|
| 0.016 | 0.005 | 0 | 0 | 0.021 |
Sensitive questions ⇝ non-response, social desirability bias
racial prejudice, corruption, even turnout
List Experiment
Script for control group:
I'm going to read you a list with the names of different groups and individuals on it. After I read the entire list, I'd like you to tell me how many of these groups and individuals you broadly support, meaning that you generally agree with the goals and policies of the group or individual. Please don't tell me which ones you generally agree with; only tell me how many groups or individuals you broadly support.
Karzai Government; National Solidarity Program; Local Farmers
List Experiment
Script for treatment group:
I'm going to read you a list with the names of different groups and individuals on it. After I read the entire list, I'd like you to tell me how many of these groups and individuals you broadly support, meaning that you generally agree with the goals and policies of the group or individual. Please don't tell me which ones you generally agree with; only tell me how many groups or individuals you broadly support.
Karzai Government; National Solidarity Program; Local Farmers; ISAF (Taliban)
Analysis of List Experiment
Proportion of those who support ISAF=¯Y(1)−¯Y(0)=0.049
- Problems with list experiments: floor and ceiling effects
| response | control | ISAF | taliban |
|---|---|---|---|
| 0 | 188 | 174 | 0 |
| 1 | 265 | 278 | 433 |
| 2 | 265 | 260 | 287 |
| 3 | 200 | 182 | 198 |
| 4 | 0 | 24 | 0 |
Your Turn
Professor Hurt-and-Confused just read their student evaluations. Eight out of 22 students filled out student course evaluations for course last Spring, whereas 7 out of 27 students filled out their course evals for the same course taught last Fall. The average scores for the two courses (taught exactly the same) are 4.5 and 3.5.
Apply the concepts from Slide 9 to explain potential causes of bias in course evaluation scores. Given this discussion, what could explain the difference in scores?
What are some ways to improve the use of student evaluations for assessing teaching effectiveness?
What You Learned
Importance of probability sampling:
ensures representativeness
enables the calculation of uncertainty (QSS Chapter 7)
Sources of bias in survey sampling
unit non-response
item non-response
social desirability bias
differential item functioning (e.g., culturally-driven diff in GRE scores)
Survey methods for sensitive questions
list experiment
randomize response method
Lab
Political Efficacy in China and Mexico
Goal: explore research tools for correcting survey measurement bias
In 2002, the World Health Organization conducted a survey of two provinces in China and three provinces in Mexico. This exercise is based on:
Gary King, Christopher J. L. Murray, Joshua A. Salomon, and Ajay Tandon. (2004). 'Enhancing the Validity and Cross-Cultural Comparability of Measurement in Survey Research.' American Political Science Review, 98:1 (February), pp.191-207.
Self-Assessment Question
How much say do you have in getting the government to address issues that interest you?
(5) Unlimited say, (4) A lot of say, (3) Some say, (2) Little say, (1) No say at all.
Data Exercise
- Download and open the data.
Compute the mean response for each country.
Plot the distribution of responses separately for China and Mexico using barplots, where the vertical axis is the proportion of respondents.
vig_chi <- subset(vig, china == 1)vig_mex <- subset(vig, china == 0)# Chinachi_table <- prop.table(table(vig_chi$self))barplot(chi_table, main = "China")# Mexicomex_table <- prop.table(table(vig_mex$self))barplot(mex_table, main = "Mexico")How Much Say Do You Have?
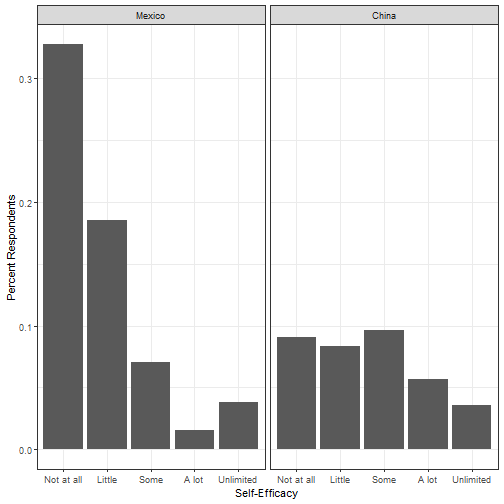
Data Exercise Cont'd
- Which country's respondents seem to have a higher degree of political efficacy? Does this seem plausible when Mexican citizens voted out the Institutional Revolutionary Party (PRI) after more than 70 years or rule and Chinese citizens have not been able to vote in a fair election to date?
Vignettes
After the self-assessment question, three vignette questions were asked.
[Alison] lacks clean drinking water. She and her neighbors are supporting an opposition candidate in the forthcoming elections that has promised to address the issue. It appears that so many people in her area feel the same way that the opposition candidate will defeat the incumbent representative.
[Jane] lacks clean drinking water because the government is pursuing an industrial development plan. In the campaign for an upcoming election, an opposition party has promised to address the issue, but she feels it would be futile to vote for the opposition since the government is certain to win.
[Moses] lacks clean drinking water. He would like to change this, but he can't vote, and feels that no one in the government cares about this issue. So he suffers in silence, hoping something will be done in the future.
The respondent was asked to assess each vignette in the same manner as the self-assessment question.
- How much say does ['name'] in getting the government to address issues that interest [him/her]?
(5) Unlimited say, (4) A lot of say, (3) Some say, (2) Little say, (1) No say at all.
Your Turn
Compute the proportion of respondents, again separately for China and Mexico, who ranks themselves (according to the self-assessment question) as having less say in the government’s decisions than Moses (the last vignette).
How many respondents in China think they have less say than Moses?
How many respondents in Mexico think they have less say than Moses?
What does this tell you?
Challenge Yourself
Restrict the data to survey respondents who ranked these three vignettes in the expected order (i.e.,
Alison≥Jane≥Moses).Now create a variable that represents how respondents rank themselves relative to each vignette. This variable should be equal to 1 if a respondent ranks themselves lower than
Moses, 2 if ranked the same asMosesor higher thanMosesbut lower thanJane, 3 if ranked the same asJaneor higher thanJanebut lower thanAlison, and 4 if ranked as high asAlisonor higher.Create the barplots of this new variable as in Question 1. The vertical axis should represent the proportion of respondents for each response category. Also, compute the mean value of this new variable separately for China and Mexico. Compare these results with those obtained in Question 1.