POL 304: Using Data to Understand Politics and Society
Lab 1: Intro to R
Olga Chyzh [www.olgachyzh.com]
1 / 10
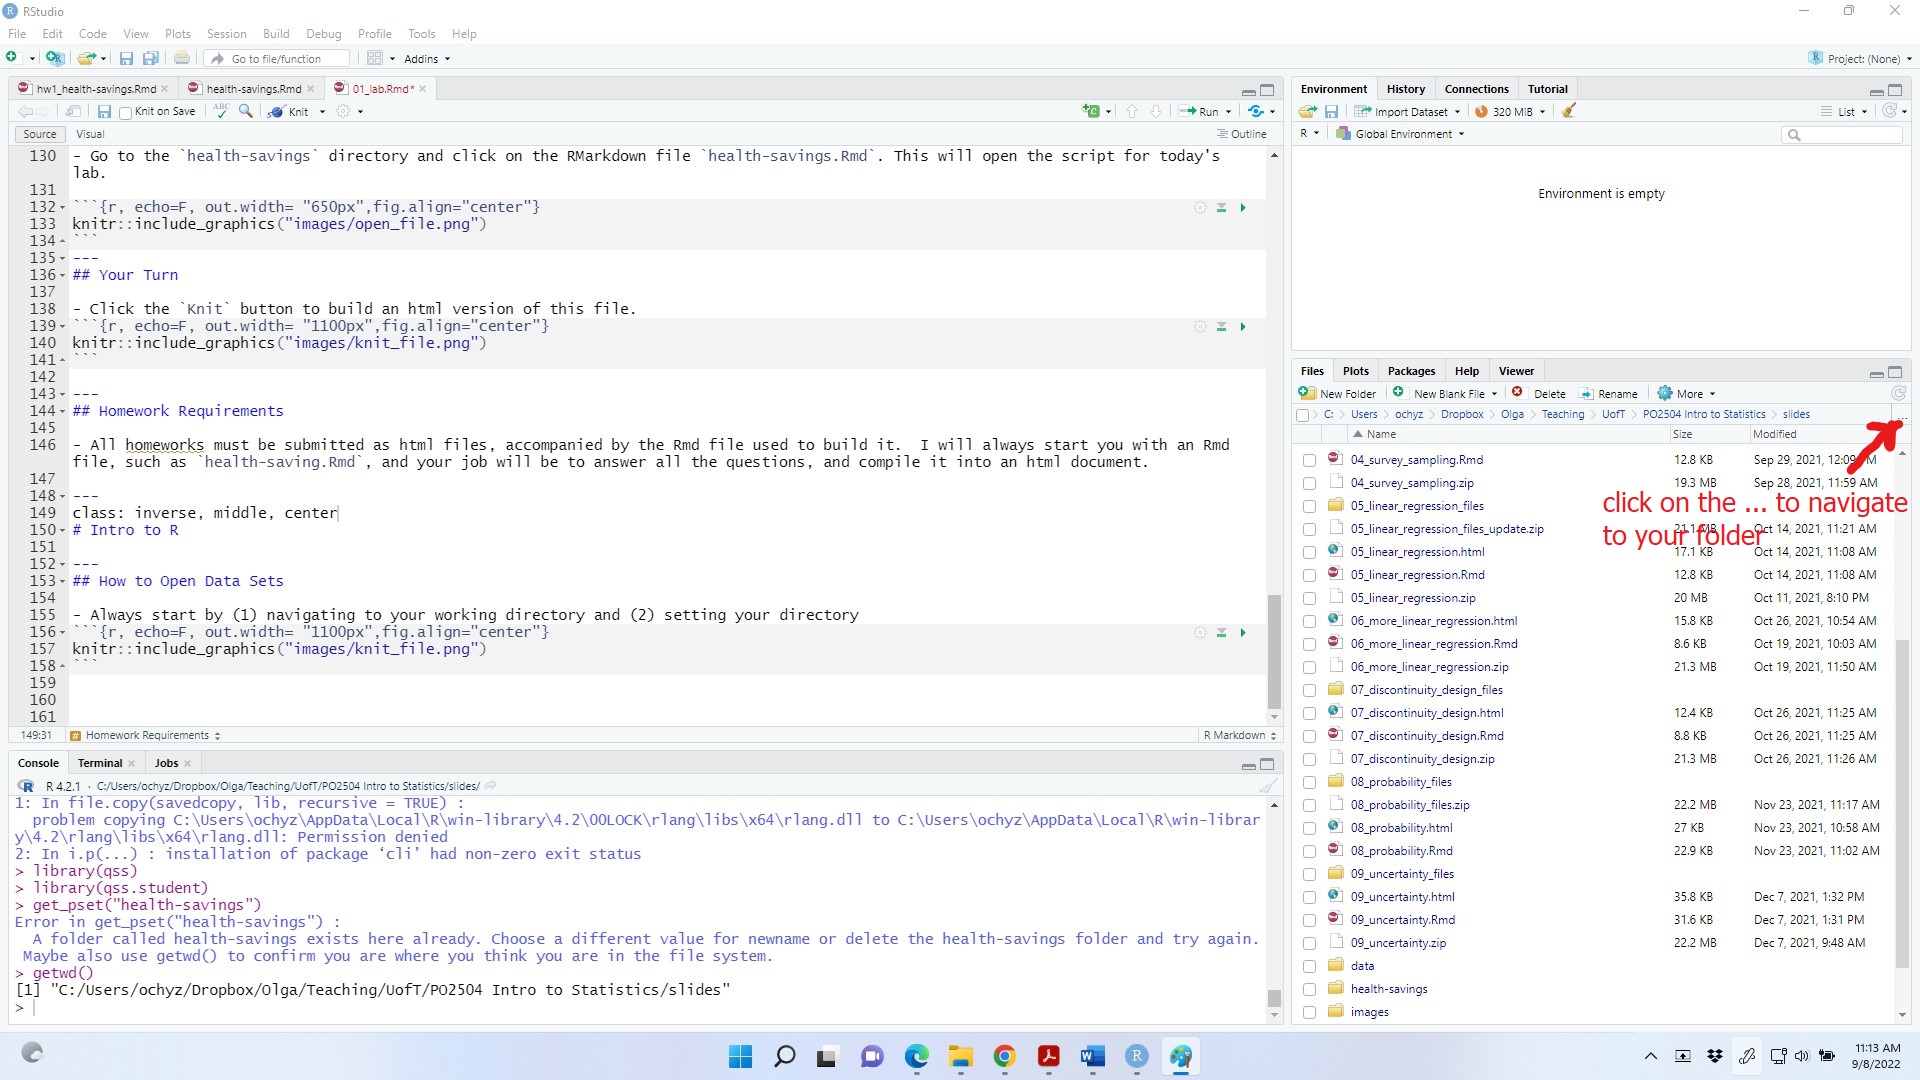
Always Start By...
- Navigating to your working directory
2 / 10
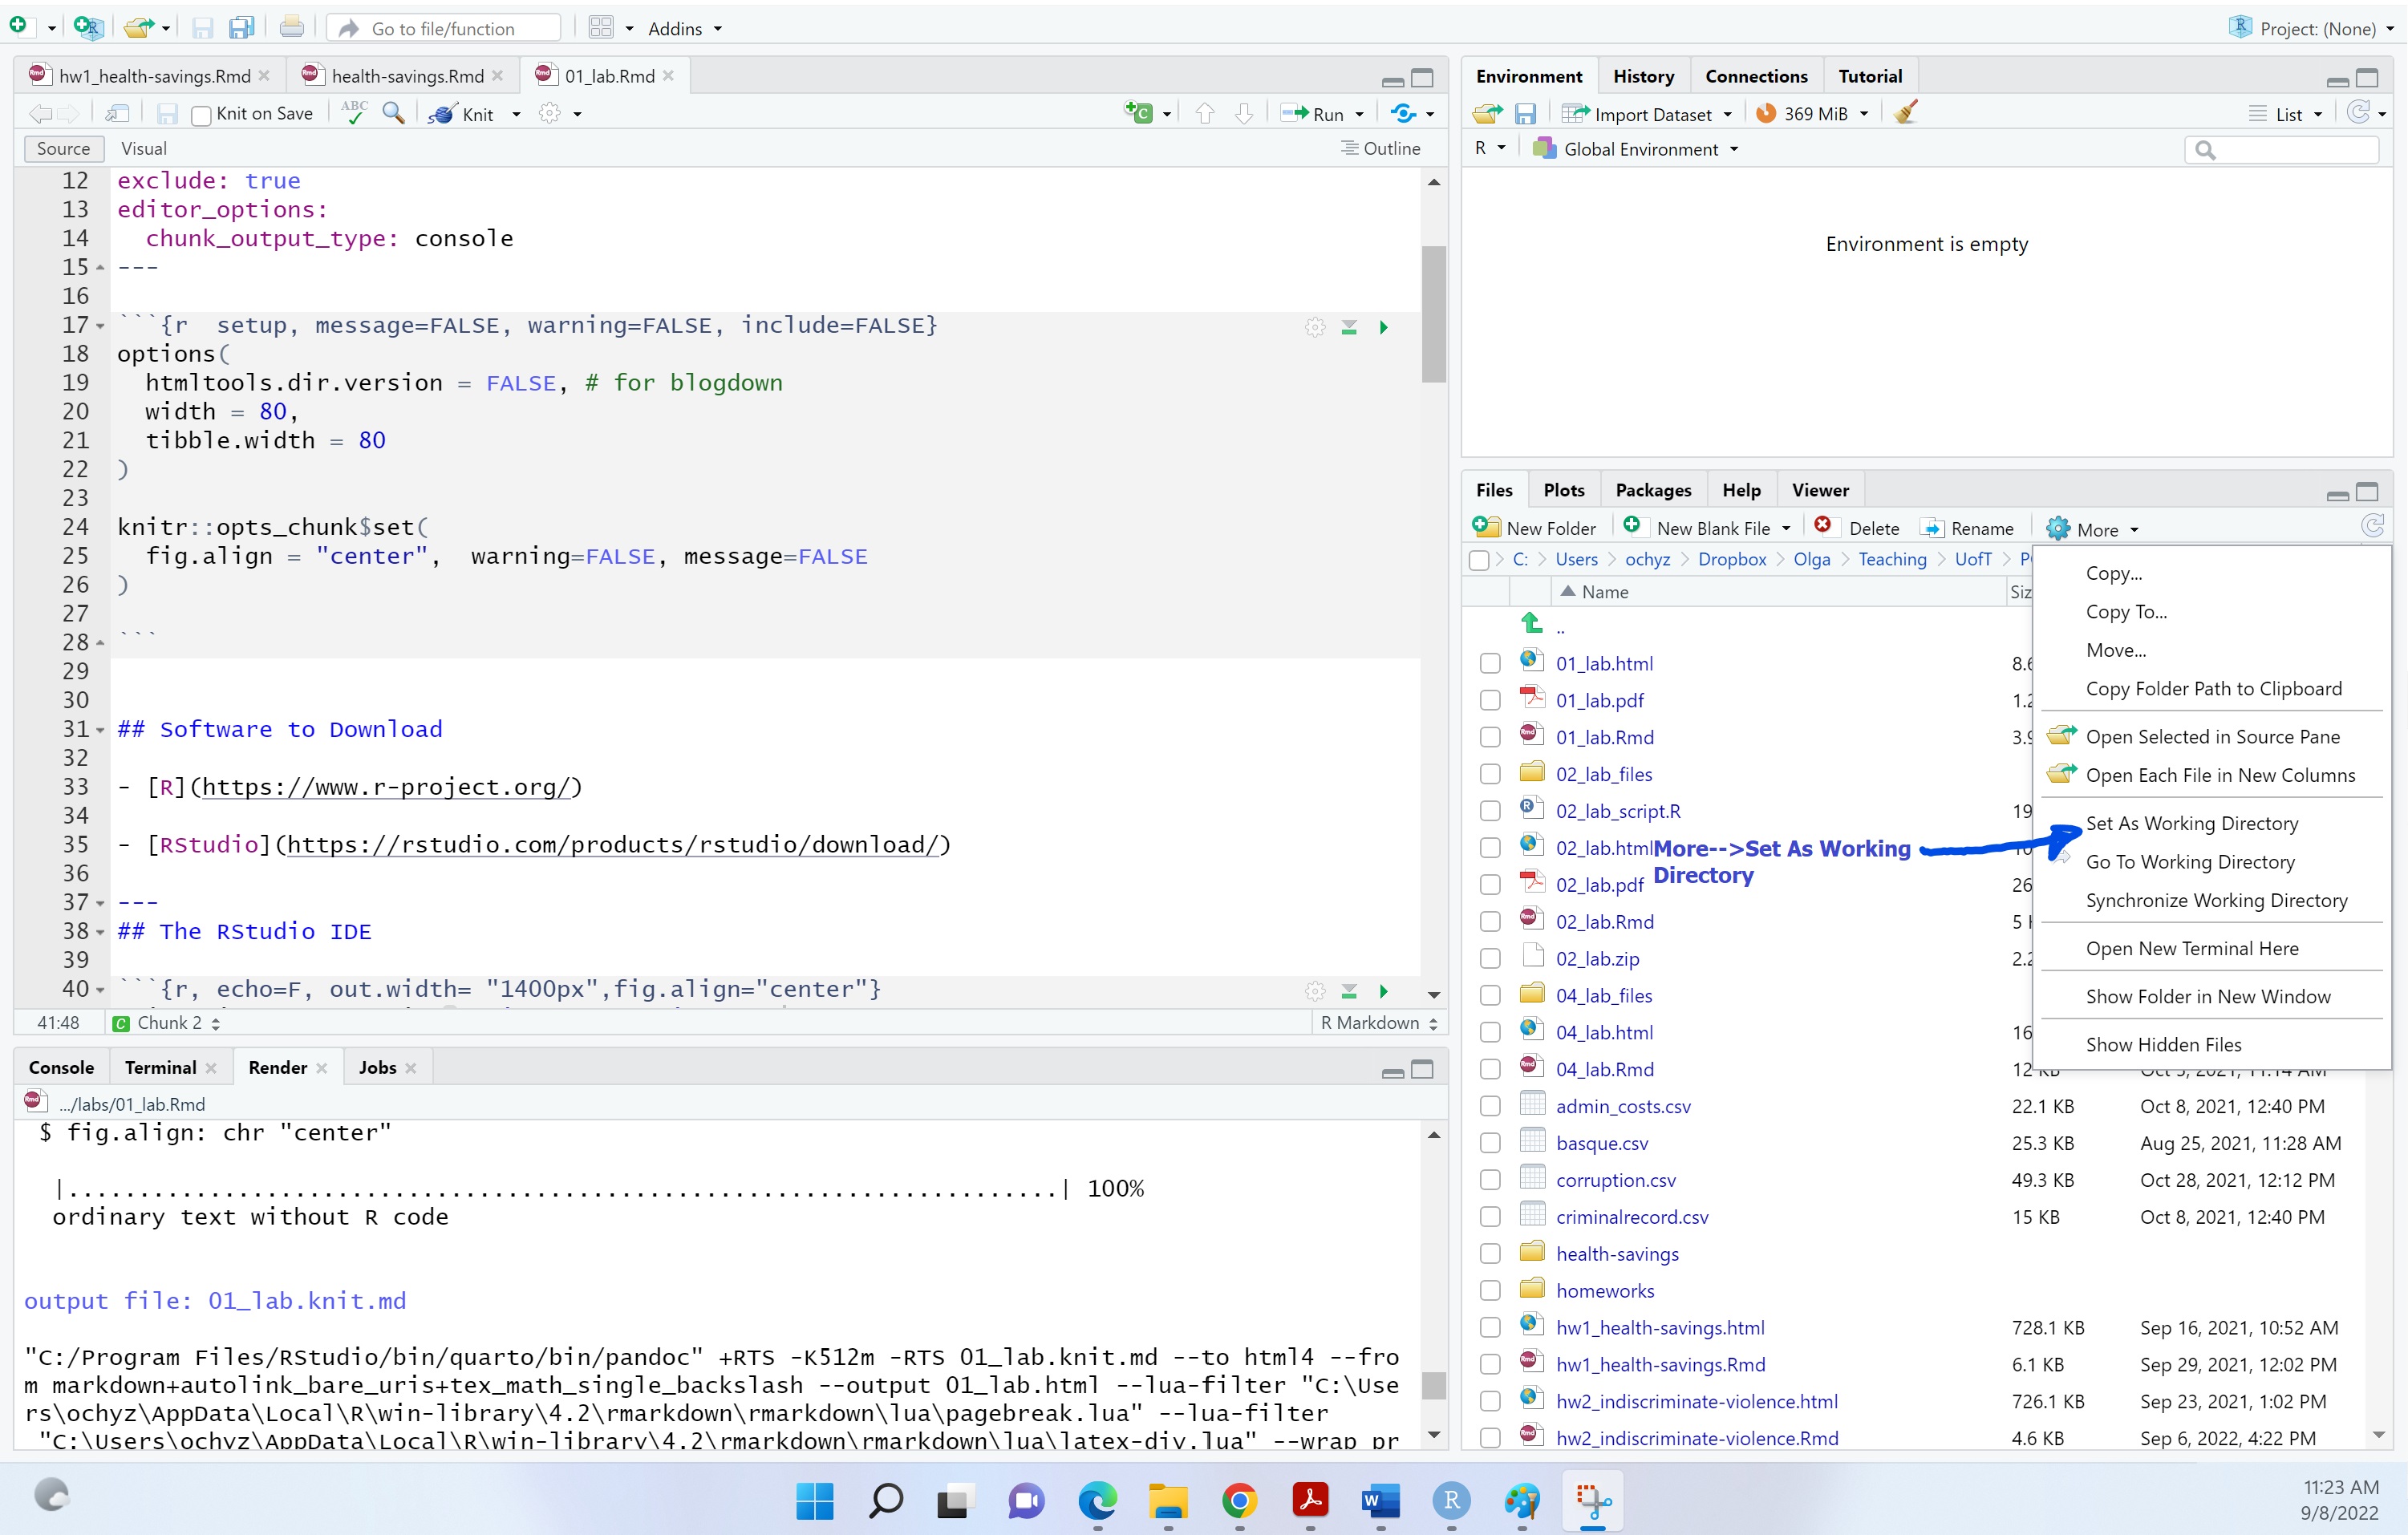
And ...
- Setting your directory
3 / 10
Open Data Files
- To open
.csvfiles, useread.csv
rosca<-read.csv('rosca.csv', header=TRUE)4 / 10
Access/Create a New Variable
rosca$bg_femalerosca$new_var<- NA5 / 10
Subset Rows by Value
Suppose you want to see the values of the fol2_amtinvest variable only for women.
rosca$fol2_amtinvest[rosca$bg_female==1]##Or create a copy of the dataset that only includes women:rosca1<- rosca$fol2_amtinvest[rosca$bg_female==1]6 / 10
Calculate the Mean
mean(rosca$fol2_amtinvest, na.rm=TRUE)mean(rosca$fol2_amtinvest[rosca$bg_female==1], na.rm=TRUE)tapply(rosca$fol2_amtinvest, rosca$bg_female,mean, na.rm=TRUE)7 / 10
Tabulate Observations by Category
table(rosca$bg_female)8 / 10
Your Turn
Create a single variable treatment that takes the value control for observations that received only encouragement, safebox if received a safe box, and lockbox if receiving a locked box. How many individuals are in the control group? How many individuals are in each of the treatment groups?
9 / 10
Challenge Yourself
- Complete the practice problem set posted on the course website.
10 / 10